Growth, Inflation and Interest
The terms Growth, Inflation and Interest are familiar enough from the news media, but this surface familiarity hides complexities. Without being synonyms, they overlap, have elements in common, mingle and contaminate each other. In this piece I share my struggles to understand.
Interest
Though usury was banned by the church for many centuries, yet the practice of paying interest on borrowed money has become accepted in the West, and for centuries we have understood that money lent will yield an increase. However, today the yield is very small.
We understand the principles of compound interest, and with it that of logarithmic growth. Suppose £100 were deposited at 4% p.a. compounded annually. At the end of the first year we would have £104.00. But at the end of the second year the account balance, though enlarged by the same factor (f=1.04), would have enlarged by a bigger amount than in the first year, and become £108.16. That is to say, our deposit grows exponentially; the increment each year is bigger, because the balance is bigger, but the factor (f ) stays constant.
We can see that the formula is:
Final deposit = initial deposit x fn
(where n=number of years, and fn means f raised to the power n
So: £108.16 = £100.000 x (1.04)2
In 18 years we would have £202.58, and we would have more than doubled our money [1].
Of course, there are many different interest rates, depending on whether you are lending or borrowing, big or small, safe or risky.
One interest rate that is of special significance in the UK is the so-called Base Rate of the Bank of England (BoE); i.e. the rate the BoE charges when it lends for short periods to commercial banks.[2] On 19th March 2020 Base Rate was lowered to 0.1% APR where it has since remained. Its record high point was 17.00% for the period 15th Nov 1979 – 3rd July 1980.
Inflation
Inflation can be thought of as the cost of a basket of purchases constructed to represent the average purchases of a household, relative to the cost of the same basket in an index (or base) year. The basket may change from year to year, as mobile phones come into fashion and horses go out. From 1750 till 1934 the value of the British pound remained rather constant overall, with periods of inflation balanced by periods of deflation. Britain finally abandoned the gold standard in 1931. From 1934 inflation has always been positive (save for 1 year during the 2009 banking crisis), but inflation has not been constant; in 1975 the annualised rate of inflation was running at 24%, but in 2020 at only 0.8%. Inflation operates as a tax on the hoarders of money.
Just as there are many different interest rates, so there are many different inflation rates, depending what you put in the basket [3,5]. Current European practice is to use the Consumer Price Index (CPI) which ignores housing costs. Until April 2011 Britain used the Retail Price Index (RPI) which included housing costs, and tends to rise a little faster then the CPI.
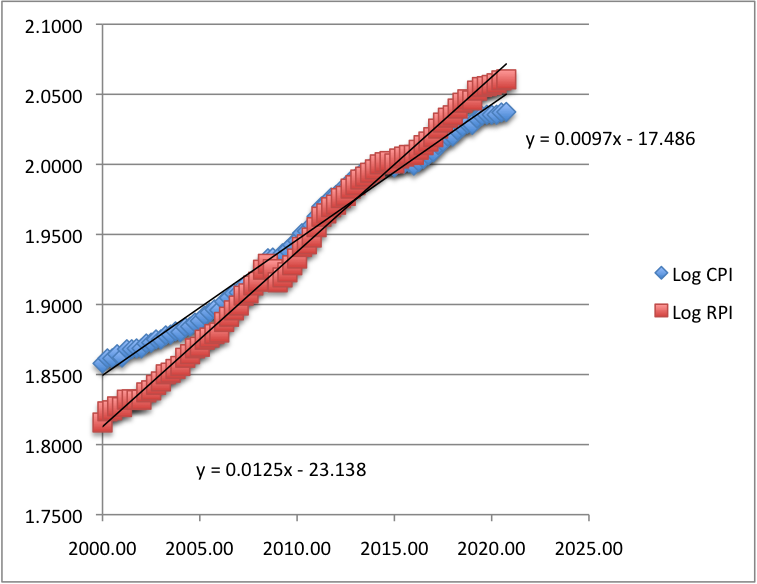
Figure 1 shows data points for each quarter year from 2000 to 2020, plotting Log(base 10) for both 'CPI' and 'RPI' against year, and fitting 'least squares' trendlines. Both sets of data swerve off the trendline at times, but it is possible to determine a convincing average annual Inflation factor (f) for each (See Fig.1 legend). Over the last 20 years RPI has averaged a growth of 2.92%, while CPI has averaged 2.26%. The cost of housing clearly grows faster than most other things in the two baskets.
Fig. 1 Plot showing Log10 CPI and RPI (UK).
Standardised to 100 for 2015, for each quarter year from 2000 to 2020. The pink squares show RPI; the blue lozenges show CPI. The slopes are obtained by least squares. In such plots, slope = Log10 f; so f = antilog (slope). Log RPI grew at an average (over that period) of 0.0125 per annum, corresponding to a factor (f) of 1.0292 p.a. or 2.92%, while Log CPI grew at an average of 0.0097 p.a.. corresponding to a factor of 1.022586 (2.25%). (The intercept values can be ignored in the present context; they point to values for the year 0 A.D..)
Gold is still a popular measure of value, and there seems to be a notion in some quarters that its value is constant, as the world supply will remain fixed (apart from the slow process of mining). But monetary policy and fashion cause arbitrary fluctuations. The real rental value of agricultural land fluctuates even more [4], buffeted by politics, and the rising population.
We probably use CPI because it is the simplest, best, agreed, means available for correcting the steady devaluation of the currency that is inflation. But it is important to keep an eye on special cases such as house and land prices. (Gold, bit-coin and the Stock-Markets are surely the concerns only of gamblers.)
'Causes' of Inflation
It seems that, in the present atmosphere of pandemic emergency, the central banks can give large quantities of 'money' to government where it is handed out to needy people at a rate not seen since WWII; and still the inflation rate is near zero. People wonder why there is no inflation.
The Austrian monetarist school believes that inflation is inevitable if the Quantity of Circulating Money (QCM) relative to the Quantity of Purchased Goods and Services (QPGS) is raised. But it is too simplistic to look only at the quantity of money in either the narrow (M0,M1) or the wide sense (M2,M3,M4), for it has to circulate, through purchases.
Causes of inflation include:-
· External price rises, e.g. oil prices.
· Insufficient production to meet demand.
· Full employment and shortages of skilled labour.
· Expectation that prices will rise.
· Expectations from 'Index-linked' wages, or pensions.
Growth
Growth of the economy is usually measured in terms of Gross Domestic Product (GDP) measured in a standard way, e.g. by totalling all the income (or all the spending) in the country, quarter by quarter (more or less in line with international practice; e.g. the European System of Accounts 2010, [6]). Clearly the total actual incomes are not computed; surely estimates are made of how many dentists, how many cleaners; and of the average dentist's salary, etc. Otherwise, what an immense task! To make these data useful they have to be corrected for the size of the population, and the current value of the £ Sterling. Thus, from Nominal GDP, we get GDP per head, and Real GDP . The latter correction is complicated [7,8], and I deal with it in the next section on Overlaps.
Overlaps: Growth and Inflation
Growth of the economy indicates a general increase of wealth (and is presumed to be 'good'); inflation on the other hand indicates erosion of value. It is essential to strip the inflation out of the Nominal growth figures. This could be done using the somewhat flawed CPI data, but is not. The CPI 'basket' of goods is seen as artificial. The GDP data purport to be the whole data set of which the CPI is a sample.
The Office of National Statistics (ONS) publish several tables of historic GDP data stretching back to 1955. One table is titled "GDP at market prices: Current Prices: Seasonally adjusted £m". A second table is titled "GDP: chained volume measures: Seasonally adjusted £m". The former (Current Prices) is clearly Nominal GDP; the second (Chained Volumes) is more obscure, but is in effect Real GDP, corrected for inflation [8], and I think that could be mentioned on the page.
Taking data points for each quarter year from 2016 to 2019 and plotting Log(base 10) GDP against date for both 'Current' and 'Chained', it is possible to determine an average annual Growth factor (f) for each. (See Fig. 2) It is obvious that the GDP growth rate using Current Prices (f=1.0361) grows at a faster rate than the Chained Volume data (f=1.0146).
Fig. 2 Semi- Log10 plot of UK GDP growth, 2016 to 2020.
The pink squares show data using Current Prices (so Nominal GDP); the blue lozenges show Chained Volumes data (so Real GDP). The slopes are obtained by least squares. In such plots, slope = Log10 f; so f = antilog (slope). Current data grew at an average (over that period) of 3.61% per annum, while the Chained data grew at an average of 1.46% p.a.. The latter data is clearly corrected for inflation, which will be given by the ratio of the two slopes ( fnominal = f realx finflation). So we see that inflation was running at an annualised rate of 2.117% over that period. (compare CPI and RPI in Fig. 1 above) . (The intercept values can be ignored in the present context; they refer to the extrapolated value of £GB in the year 0 A.D.)
In the Chained Volumes method of adjusting for inflation [8], there is no 'base' year. First the cost of the GDP basket for a given year is calculated as a product of price and quantity for each item. (These products are called volumes but the units are £GB as the quantities are dimensionless numbers.) The volumes are aggregated over the entire productive economy producing Aggregate at Current Year's Prices (ACYP). Then the exercise is repeated using the same year's quantities but the previous year's prices, producing APYP. Dividing ACYP by APYP produces a quotient (Q(n), where n is the given year) which is the factor by which all prices increased over the previous twelve months, weighted according to their importance in the economy. By chaining successive quotients (Q(n) x Q(n+1) x Q(n+2) etc.,) one can determine the course of inflation over a period of years and also determine the real Growth Rate of the economy.
Overlaps: Interest Rate and Inflation
Over the centuries the UK Treasury has sold undated bonds to raise money to pay for e.g. The South Sea Bubble, and various wars, offering interests rates of up to 4%. Various debts of this sort were consolidated in 1927 as undated 4% consols, but were retired or bought back by the government in 2015. Of course, the sums involved have shrunk in importance due to inflation; £100 in 1927 would have had the purchasing power of £6,323.57. in today's money (as inflation has averaged 4.56% per year in the intervening period). The owner of such a consol thought he was gaining at 4% p.a., but was in fact losing at 0.56%.
Inflation seems not to arise from the rapid and arbitrary extension of credit to the Government for the paying of bills (often seen as the "printing paper money"). That has been done on a massive scale since the banking crisis of 2008, and currently during the COVID pandemic. Yet interest rates and inflation are both extremely low.
But inflation did occur in 1975 under the influence of (a) OPEC oil price rises, (b) leap frogging wage claims by undisciplined trade unions, and (c) the expectation of rising prices.
With inflation at 24% APR, it seems reasonable to charge roughly the same in interest, otherwise the lender eventually pays back only a fraction of what he borrowed. Tough luck if you took out a loan at 5%, then found the rate rise to 15%. Similarly, inflation peaked in 1990 at 9.46%, with Bank of England base rate peaking a few months earlier in October 1989 at 14.88%, while 5, 15, and 25 yr Gilts all peaked in April 1990 [9]
Overlaps: Interest Rate and Growth
For centuries the central bankers have manipulated the Base Interest Rate in an attempt to control Inflation and Growth. When they want the business cycle to slow down they raised base-rate in the expectation (largely realised) that all other rates would go up, and borrowers and buyers would hesitate. It was similarly believed that that "lowering of interest rates would encourage growth of GDP"
Lee and Werner (2018) [10] challenged that theory – that lowering "interest rates" encourages growth of GDP. For 4 major economies (Japan, USA, UK, and Germany), they plotted the fluctuations of Nominal GDP on top of the fluctuating interest rate of contemporary government bonds. They concluded that interest rates follow GDP growth (rather than precede) and are positively correlated with growth (rather than negatively correlated). Well yes! Is that not the same thing? If a rise in GDP is routinely followed by a fall? What is clear is that the BoE raised base rate before the peak of inflation, and bond rates rose soon after base rate. But I do not think the utility of central bank operation can be tested in that way; it is very difficult to strip inflation out of GDP data –– and Lee and Werner did not even try to do so.
Conclusions
My conclusions, from this discussion, can be summarised:
(1) Inflation is subject to external influences, such as oil prices, which the BoE cannot influence.
(2) The financial world is largely composed of greedy gamblers who hope to make their money from the rising and falling of stock prices where the smart can take money off the less smart.
(3) In large part the business cycle is driven by expectation. Announcing a forecast can be as effective as raising or lowering base rate. Your decision to build a factory is based, not on today's interest rates and markets, but on those you expect in 2 - 5 years time.
(4) The absurd inflation rates of 1979 and 1989 suggest mis-management of the economy.
(5) Close attention will be required to control credit, when money begins to circulate again.
(Please comment directly to cawstein@gmail.com )
References
[1] The doubling time (nd) is a useful alternative measure of the interest rate factor, (i.e. f); and each can be calculated from the other. If nd is the doubling time in years.
2 = f nd ; f= nd√2
[2] https://www.bankofengland.co.uk/boeapps/database/Bank-Rate.asp
[3] See my previous post on "CONSUMER versus RETAIL PRICE INDICES"
[4] Lloyd, T. (1992) "Present value models of agricultural land prices in England and Wales". PhD thesis, University of Nottingham.
[5] Shaun Richards quoted Andrew Sentance (24th March 2021)
[6]https://www.ons.gov.uk/economy/nationalaccounts/uksectoraccounts/methodologies/nationalaccounts.
[7]https://www.ons.gov.uk/economy/nationalaccounts/uksectoraccounts/methodologies/chainlinkingmethodsusedwithintheuknationalaccounts
[8] https://www.oecd-ilibrary.org/docserver/9789264027657-2-en.pdf?expires=1617443621&id=id&accname=guest&checksum=5F6F66D21A4173A9AB86F5D591A569FC
[9]https://www.bankofengland.co.uk/-/media/boe/files/quarterly-bulletin/1991/the-gilt-edged-market-developments-in-1990.pdf?la=en&hash=8A97A143E4A2ECCE8353116627AF1A4103EF4488
[10] https://www.sciencedirect.com/science/article/pii/S0921800916307510#bb0020
(Please comment directly to cawstein@gmail.com )